PPS considers which high schools students should attend in boundary review

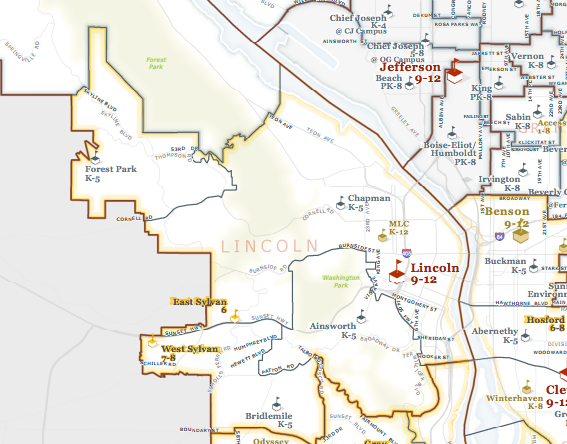
The PPS boundary map indicates the zones in which residents are eligible to attend Lincoln.
Jefferson High School’s student body is 57 percent African-American. Lincoln’s percentage is three. Portland Public Schools is aiming to correct that. A district-wide boundary review committee is not only charged with balancing enrollment, but also looking to balance diversity.
Equity is a “guiding value” for the committee.
“Every student regardless of race, income or zip code should achieve their potential and thrive at PPS,” the committee’s framework reads. “In the current system, there are significant disparities in student success.”
The statistics are striking. Lincoln lags most other district high schools in minority enrollment. According to PPS data for 2014-’15, the latest available, Lincoln has the second most white students in the district. It also has the lowest percentage of Hispanic, African-American, Pacific Islander and Native American students.
The committee will try to bridge those gaps by changing the boundaries of school attendance areas.
Some disparities are caused by the district’s use of the Willamette River, which splits the city’s wealthier Westside from the East, as a boundary between schools. That may change, committee chairman Jason Trombley told OPB’s Think Out Loud in September.
“My committee was charged with conducting a districtwide review of all boundaries, and to take a look at what’s going to be best for kids, and the health of the system,” he said on the program. “As far as I’m concerned, everything is on the table for consideration.”
Sophomore Nolan Johnson’s recent survey showed Lincoln students believe the Eastside is more dangerous than the Westside. Several responses cited the reason as there are “more black people there.”
Historical records show that PPS once used boundaries to segregate students. As recently as the 1980s, “mandatory busing to distant schools affected African-American students who often traveled far from their homes to attend integrated schools; white students attended their closest neighborhood school,” according to Oregon Historical Society records from 1982.
Though small boundary adjustments are common for PPS, such major changes involving the convention of a committee are rare.
It’s unlikely recommended changes would be quietly accepted. Any change is likely to anger parents who have deep connections to their school, which is why the committee will be taking public comment throughout the fall as it develops its recommendations. Dates will be posted on the PPS website.
The school board is expected to vote on the new boundary recommendations early next year. The changes would go into effect in 2016-’17 school year; however, they would not affect students already attending a school.
Map of current PPS district boundaries: http://www.pps.k12.or.us/files/about-us/PPS_District.pdf
Racial breakdown of PPS high schools, 2014-15
Source: PPS Enrollment Report 2014-15, U.S. Census Bureau
| School | Hispanic | African-American | Asian | Other | White | Multiple |
| Benson | 25.6 | 21.2 | 14.6 | 1.6 | 30.4 | 6.7 |
| Cleveland | 10.0 | 4.4 | 9.8 | 1.8 | 67.8 | 6.3 |
| Franklin | 19.8 | 5.6 | 18.6 | 1.7 | 49.1 | 5.2 |
| Grant | 7.7 | 13.0 | 4.4 | 1.1 | 65.1 | 8.7 |
| Jefferson | 12.6 | 57.0 | 0.8 | 4.4 | 18.9 | 6.3 |
| Lincoln | 7.6 | 3.0 | 9.3 | 0.6 | 73.8 | 5.7 |
| Madison | 22.8 | 17.0 | 16.6 | 3.8 | 32.8 | 7.1 |
| Roosevelt | 36.4 | 21.8 | 4.4 | 3.7 | 27.2 | 6.4 |
| Wilson | 8.9 | 5.0 | 4.6 | 1.2 | 74.7 | 5.6 |
| All PPS high schools | 15.6 | 12.2 | 9.8 | 1.9 | 54.1 | 6.4 |
| Portland | 9.4 | 6.3 | 7.1 | 1.5 | 76.1 | — |
